Subtitle: “Derrrr … alert on stuff.”
For awhile now, we’ve been in a foggy area with our monitoring and alerting. I’ve been aware for months that we should be doing more than we currently are. We’ve been running Nagios for years and do an okay job with it in basic form. We also have Ganglia metrics being collected for all of our servers, but they are largely ignored until needed for debugging. And finally, I’ve also just started seriously evaluating Graphite + various collectors as of 2 weeks ago. We do not currently perform any alerting based on the data in Ganglia. It is all a slowly moving work in progress.
Today, I just so happened to have a look at Ganglia and noticed 2 servers with elevated status (showing as yellow instead of green). They were both OpenAFS “database” servers (we have 4), and for the sake of not sidetracking this blog post, are largely depended on for providing OpenAFS storage volume location information.
It’s worth pointing out that there was no noticeable OpenAFS service degradation to the clients of the affected servers.
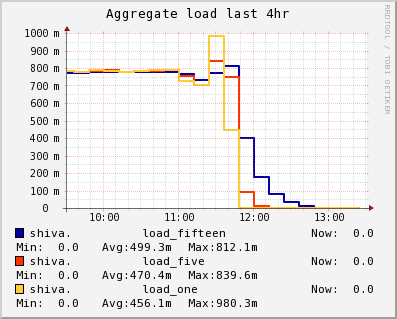
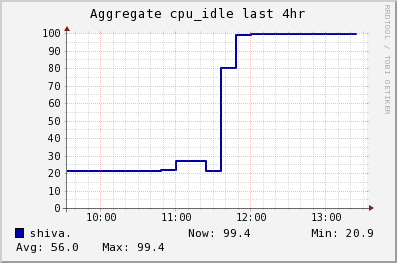
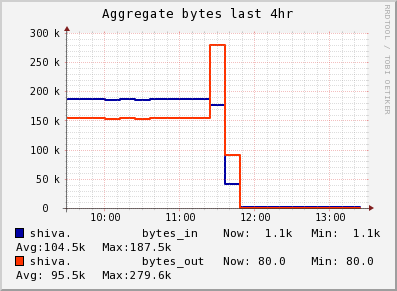
We’ll only look at one because they both suffered the same problem. Below, you can see to the left side of the graphs the scene I was presented at the time I noticed the problem. We have completely flat load that is elevated, completely flat low CPU idle time, and a completely flat stream of ~360KB/sec total network traffic:


Though the graphs above show the last 4 hours, digging further back in time (not shown here) showed that this situation started at around 9AM on April 9th. The flat graph shape seen above at the left of all 3 graphs was found in our data from that day and time all the way to today! Hmmm. What changed around 9AM on April 9th? A little digging through my email and our revision control history showed absolutely nothing, so it was time to dive in with no hints.
I found the OpenAFS Volume Location server process, vlserver, eating a steady ~60% of the CPU on each of the 2 servers in question. Additionally, looking into the flat ~360KB/sec network data with snoop showed a solid stream of OpenAFS UDP packets coming from port 7001 on a client node to port 7003 (vlserver!) on this server:
# OpenAFS client request to vlserver then response back
rogle.ourdomain -> shiva.ourdomain UDP D=7003 S=7001 LEN=56
shiva.ourdomain -> rogle.ourdomain UDP D=7001 S=7003 LEN=40
Very rough calculations indicate at least 2500 of these exchanges were happening per second.
Was this legit traffic from some long-running job created by one of the engineers? Looking more closely with snoop -x showed that the request and response were identical every time. Something was clearly broken somewhere on host rogle.
Once logged into rogle, I found 2 bash processes with high CPU utilization time. One is shown below.
jfivale 19137 1 0 Mar07 ? 03:43:03 bash
That’s not so interesting on its own, but adding in the detail that bash for our users is actually /afs/rcf.ourdomain/some/path/bin/bash changes things quite a bit.
Brain says:
Wait a second. Some number of days ago we had a weird situation where we had to kill off 5-10
bashprocesses on several hosts due to them eating loads of CPU time. They had eaten far more CPU time than these, but this is getting familiar.
Sure enough, when I attached to the processes with strace -f, they showed the same behavior as the broken processes a week or so ago:
...
rt_sigreturn(0x7)                       = 0
--- SIGBUS (Bus error) @ 0 (0) ---
rt_sigreturn(0x7)                       = 0
--- SIGBUS (Bus error) @ 0 (0) ---
rt_sigreturn(0x7)                       = 0
--- SIGBUS (Bus error) @ 0 (0) ---
rt_sigreturn(0x7)                       = 0
--- SIGBUS (Bus error) @ 0 (0) ---
rt_sigreturn(0x7)                       = 0
--- SIGBUS (Bus error) @ 0 (0) ---
rt_sigreturn(0x7)                       = 0
--- SIGBUS (Bus error) @ 0 (0) ---
...
or alternatively:
...
--- SIGSEGV (Segmentation fault) @ 0 (0) ---
rt_sigreturn(0xb)                       = 316804680
--- SIGSEGV (Segmentation fault) @ 0 (0) ---
rt_sigreturn(0xb)                       = 316804680
--- SIGSEGV (Segmentation fault) @ 0 (0) ---
rt_sigreturn(0xb)                       = 316804680
--- SIGSEGV (Segmentation fault) @ 0 (0) ---
rt_sigreturn(0xb)                       = 316804680
--- SIGSEGV (Segmentation fault) @ 0 (0) ---
...
Once I had killed off the offending bash processes, both of the affected servers returned to the normalcy you see in the right-hand portion of the graphs above.
The question then was: What was going on with the bash processes? Unfortunately, I have no answer. The bash processes that spiraled out of control all belonged to a small subset of a certain department’s users and no other problematic instances of the same binary on the same hosts were reported.
Alert on things that are abnormalities in your particular environment. Over 2500 volume location lookups per second is not normal for us. A flat and consistent load on our OpenAFS servers is also not normal. This should have been noticed and fixed within a few hours on April 9th.
We just saw some bash processes behaving the same way: four bash processes on one CentOS server eating all the cpu, showing the same output with strace. It turned out that a user had been attempting to configure a color command prompt for bash. Somehow this was causing bash to spin calling rt_sigreturn as you reported above.